The numbers on our About Us page are based on TimeToCargo product usage, subscription data, supported carrier coverage, and shipment tracking activity. Because each metric describes a different part of the platform, the underlying datasets and measurement periods may differ. Below, we explain what each number represents and how it is calculated.
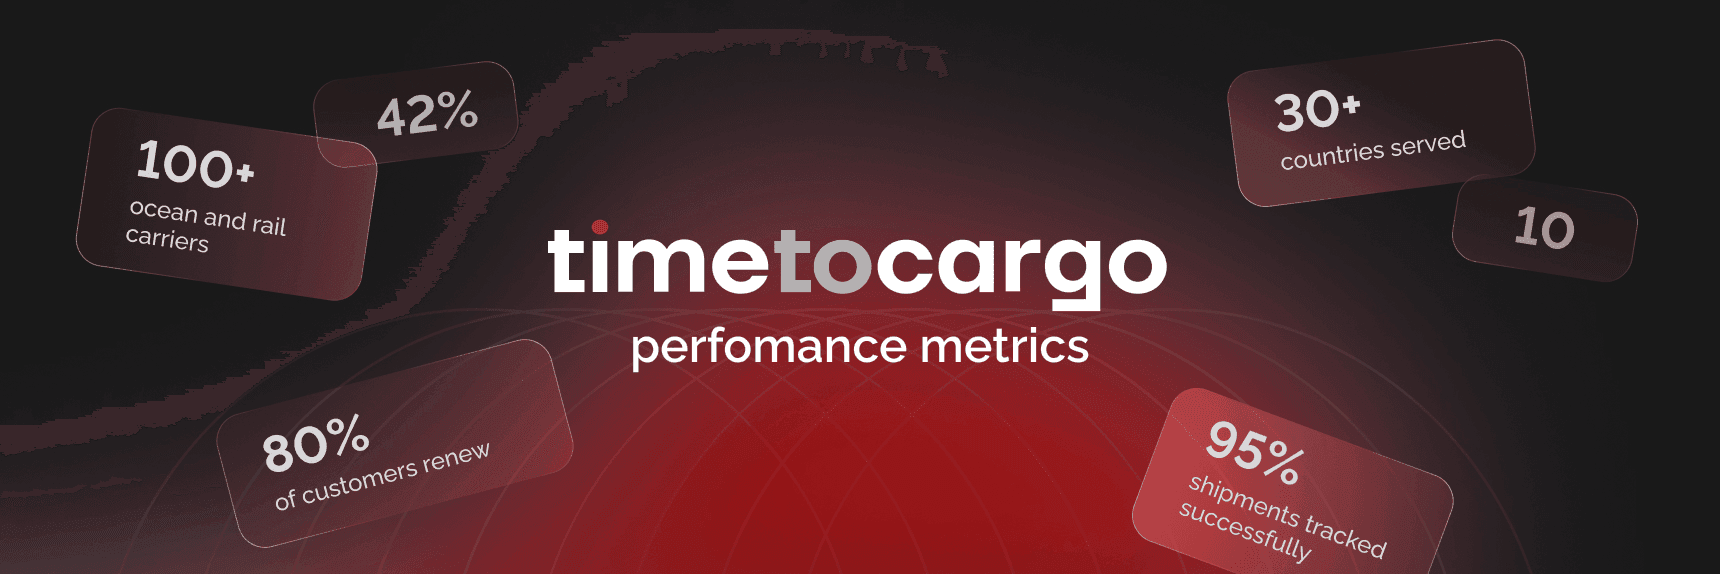
100+ ocean and rail carriers supported
This number represents the ocean and rail carriers whose shipment data can currently be tracked through TimeToCargo.
We maintain a list of supported carriers and update the figure as new integrations are added or existing integrations change.
30+ countries served
This metric shows the geographic reach of TimeToCargo customers. We count the countries associated with customers who purchased a TimeToCargo subscription through Stripe.
80% of customers renew
This metric measures the share of customers who renewed their subscription after their initial paid subscription period, including both monthly and annual plan renewals.
Trial renewals and trial extensions are excluded from the calculation.
10 carrier sources unified in one workflow
International shipments often involve multiple carriers and data sources. To estimate how many separate sources TimeToCargo replaces with one tracking workflow, we look at customers who actively use the platform for a meaningful number of shipments (at least 20 shipments). Counting this data source brings the average to approximately 10 sources consolidated into one workflow.
42% of customers received an ETA change alert
TimeToCargo can notify customers when the estimated arrival time of a tracked shipment changes.
This metric represents the share of unique customers with at least one successfully tracked container who received at least one ETA change notification during the measurement period.
Each customer is counted only once, regardless of how many containers they tracked or how many ETA change notifications they received.
Importantly, this metric does not mean that 42% of all containers were delayed. It shows the share of customers who encountered at least one ETA change among their tracked shipments during the measurement period.
95% of shipments tracked successfully
We compare the carriers supported by TimeToCargo with Alphaliner fleet data and calculate their combined share of global liner capacity in TEU.
The percentage describes carrier coverage rather than the success rate of individual tracking requests. Whether a specific shipment can be tracked also depends on carrier data availability and the shipment identifier provided.
Why the numbers may change
TimeToCargo continues to expand carrier coverage, customer base, and tracking capabilities, so these metrics may change over time. We periodically recalculate the figures using the same methodology and update the About Us page when the underlying data changes.